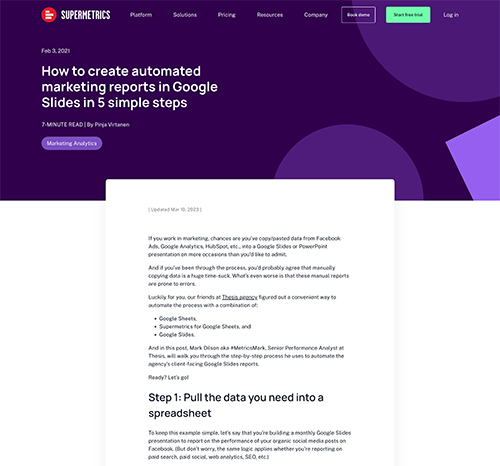
If you work in marketing, chances are you’ve copy/pasted data from Facebook Ads, Google Analytics, HubSpot, etc., into a Google Slides or PowerPoint presentation on more occasions than you’d like to admit. Luckily for you, there is a convenient way to automate the process with a combination of Supermetrics, Google Sheets, and Google Slides.
PUBLICATIONS

How to create automated marketing reports in Google Slides in 5 simple steps - Supermetrics

How to measure brand awareness with Mark Dilson - Supermetrics
In this episode of the Marketing Analytics Show, Mark Dilson discusses how to measure brand awareness effectively.

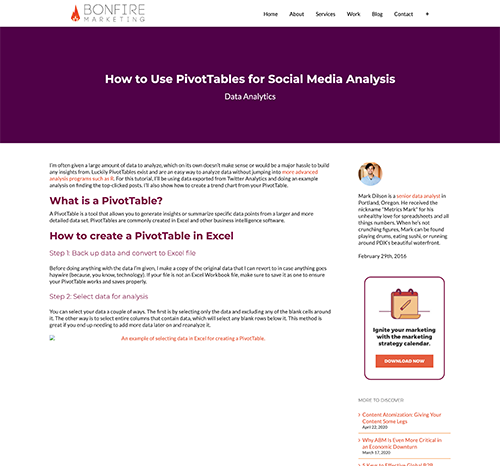
How to Use PivotTables for Social Media Analysis
PivotTables exist and are an easy way to analyze data without jumping into more advanced analysis programs.
Disclaimer: Bonfire Marketing was acquired by Thesis. Due to this, the article is not loading properly and will redirect to Thesis’ homepage after ~5 seconds.

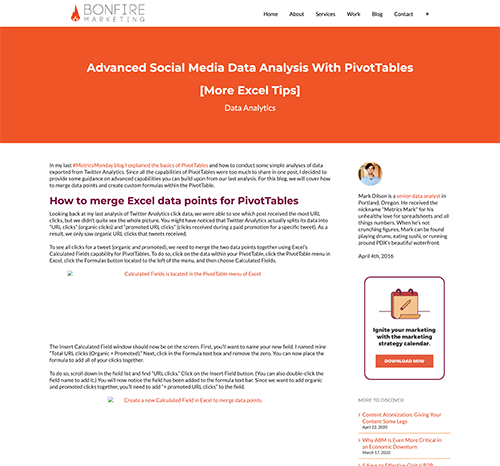
Advanced Social Media Data Analysis With PivotTables [More Excel Tips]
Migrating data can be tricky, but it’s not rocket science. Learn how to merge data points and create custom formulas within the PivotTable.
Disclaimer: Bonfire Marketing was acquired by Thesis. Due to this, the article is not loading properly and will redirect to Thesis’ homepage after ~5 seconds.
How to and Why Create UTMs for Your Marketing Channels
What is a UTM Code? (Urchin Tracking Module) A UTM is a snippet of code, also called parameters, added to the end of links in order to track promoted content to your website. The three required parameters added to links are Campaign, Source, and Medium.
Disclaimer: Bonfire Marketing was acquired by Thesis. Due to this, the article is not loading properly and will redirect to Thesis’ homepage after ~5 seconds.

